Ground motion modeling dashboard
Simulation-based seismic hazard assessment is both important to urgent disaster response as well as to efforts to bridging the data gap between observations of background seismicity and possible high magnitude events. It is therefore important that running accurate simulations at scale is accessible to researchers without the overhead of learning new programming languages or recurring simulation details. At Mondaic, we want to make our powerful Salvus software usable to a wide audience.
Part of our work on the DT-Geo project has been to distill our experience of running large-scale simulations for Earthquake hazard analysis into reproducible workflows that require minimal repetitive setup, while enabling the host of details that Salvus can accomodate.
To this extent, we implemented a seismic hazard dashboard that can dispatch fully functional Salvus simulations from the browser, while still taking advantage of:
- Fully 3D models.
- Extensive source descriptions and customizable domains.
- HPC acceleration.
- Rapid analysis and flexible outputs.
In this case study, we demonstrate how our dashboard allows users to setup high-fidelity ground motion simulations, and dispatch them to the Salvus engine.
Setting up a ground motion analysis
To simulate the ground motion response to a seismic event, Salvus needs multiple inputs, as well as a configuration describing how to run the simulations. The dashboard takes the user through these steps in the following order.
Event and domain setup
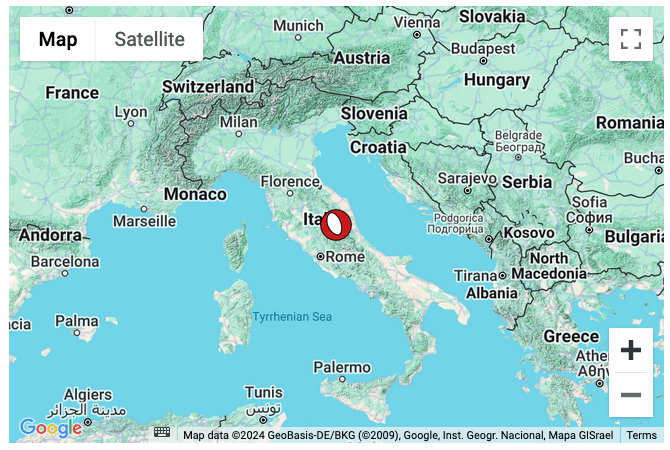
The first step is to determine which event Salvus should simulate. This is done by supplying a QuakeML file. These can be obtained by e.g. querying the IRIS event service for existing events, or can be generated at will for hypothesized events. In this demo, we'll use the QuakeML file for a 6.6 Mw event in central Italy on October 30th, 2016, as listed here.
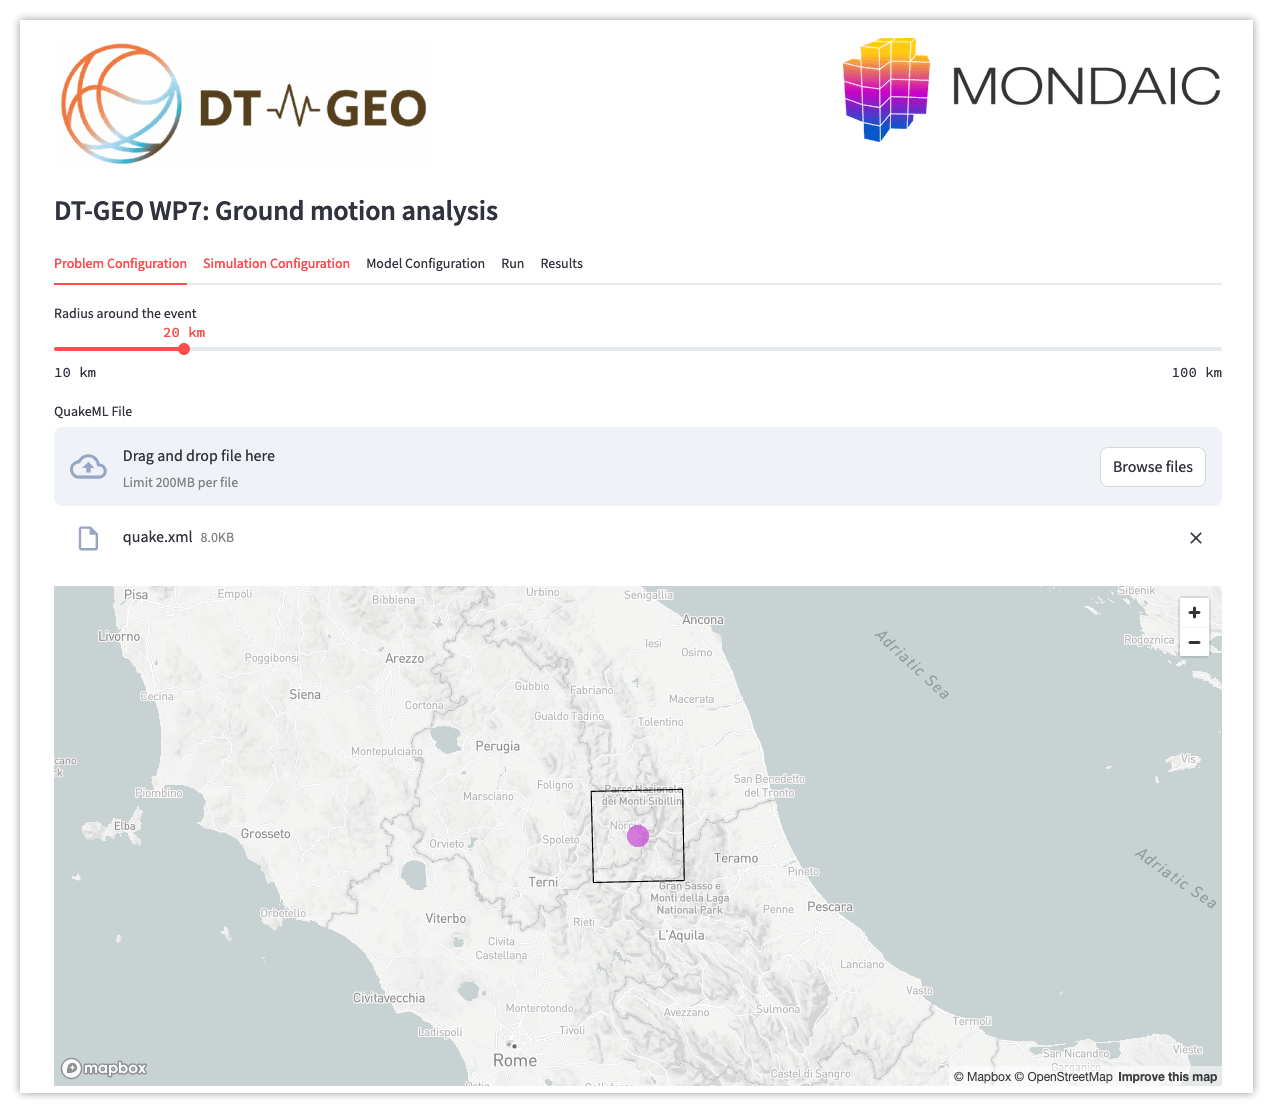
The first page of the dashboard, the 'Problem Configuration', allows one to load an event from a QuakeML file. Doing this will prompt the user with an additional domain widget. This widget allows the user to select the extent of the simulation simply by setting a radius in meters, giving the user control over the trade-off between computational cost and domain of analysis. The snapshot below shows the simulation domain created from a radius of 20 kilometers combined with the central Italy event.
Setting up the simulation and computational resources
The next page of the dashboard allows users to specify where and how the Salvus simulation is run. Using Salvus' built in handling of remote resources, any computational resource that can be defined in Salvus, e.g. local machines, SSH-based connections or even HPC schedulers like SLURM, can be addressed via the web interface. This allows users to scale their work beyond their local workstation's computational limitations.
Additionally, this 'Simulation Configuration' page also allows user to further control the trade-off between simulation accuracy and computational expense by defining the temporal and spatial resolution of the simulations. This is done by setting the maximum resolved frequency in Hertz. Using a higher frequency means that the mesh generated will contain more elements, both raising the resolving power of the simulation as well as the computational cost.
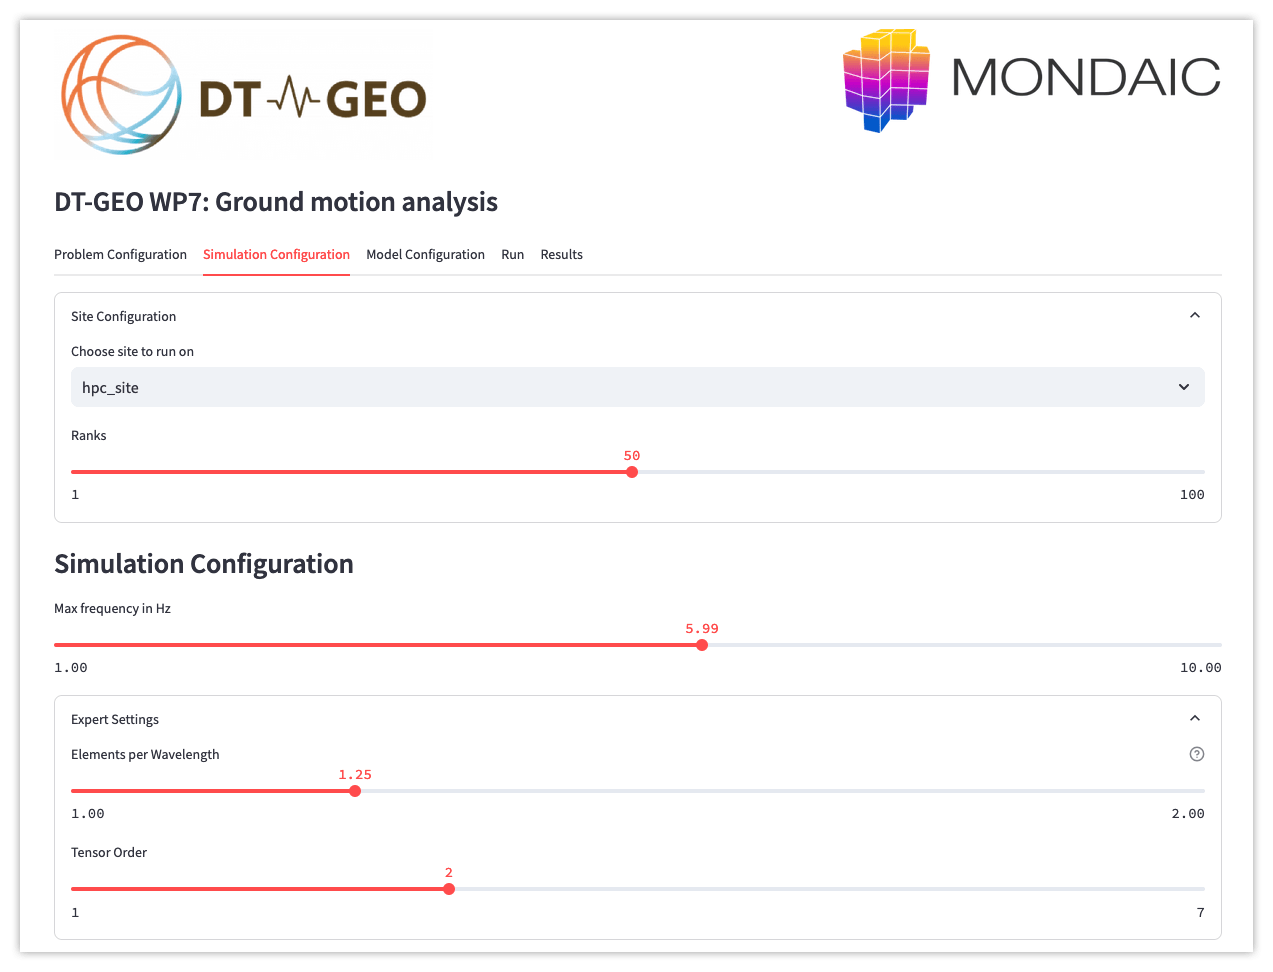
For this example, we'll simulate at 1 Hz with a resolution of 1.25 wavelengths per element.
Using 3D models
As the simulation engine Salvus is a fully 3D Spectral Element solver, one can take full advantage of the method to get the highest fidelity ground motion modelling. This means that ideally, one includes as much subsurface and geometrical information as possible, to get the most accurate modelling. The dashboard allows users to integrate multiple sources of subsurface information.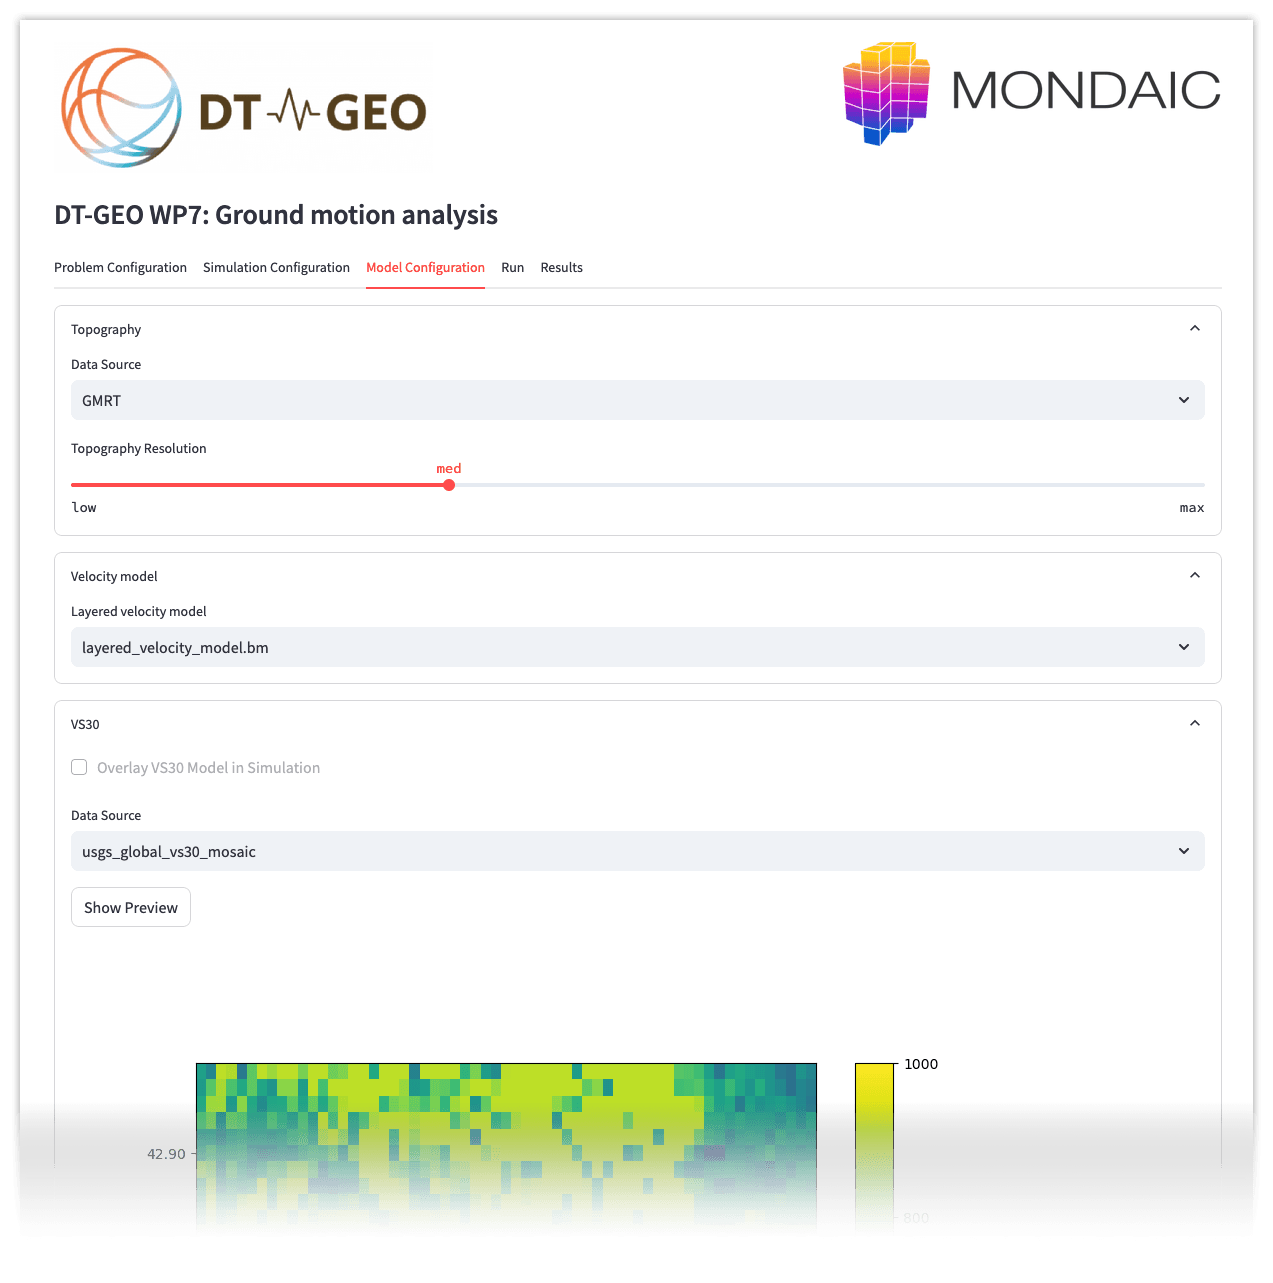
- Velocity models: The dashboard allows one to create a repository of layered velocity models as well as volumetric velocity models, which can be loaded at will per event investigated.
- Topographic information: The dashboard will automatically download the relevant topography at the appropriate resolution for the frequencies simulated.
- Shallow subsurface structure: Using model blending techniques, the dashboard can automatically combine volumetric velocity models for the deep (100m+) subsurface and the topography with an average shallow shear-velocity, or VS30, model.
All these models are integrated using Salvus' advanced layered mesher interface. By defining standard data sources for topograhy (GMRT) and VS30 (USGS) and using the layered mesher interface, user input at this step is minimized, allowing rapid prototyping and production. More data sources can be added by the user. In the central Italy example, a layered velocity model is used, combined with the GMRT topography and USGS's VS30 model.
Running simulations
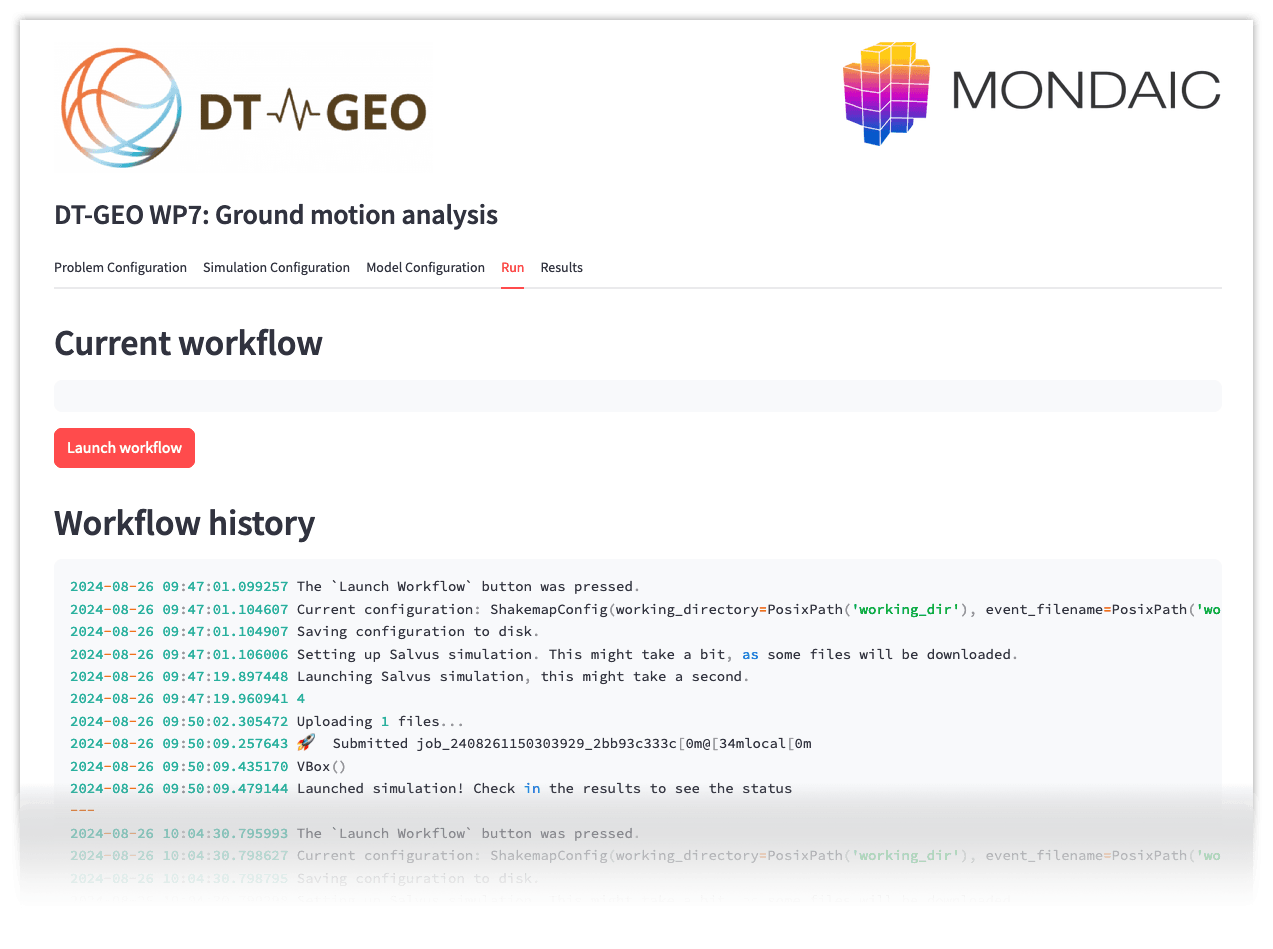
Launching the completed configuration is done simply from the 'Run' page of the dashboard. Pressing the launch workflow button will dispatch the configured Salvus simulation to local or remote resources asynchronously, allowing a user to immediately create more variations to be dispatched or queued. This page also functions as a log of all previously ran simulations.
Ground motion output
The simulations that are dispatched from the dashboard record all ground motion in the domain. What this means is that for every location, a time history of the movement is recorded during the simulation. This is a very flexible output format, as it allows a user to:
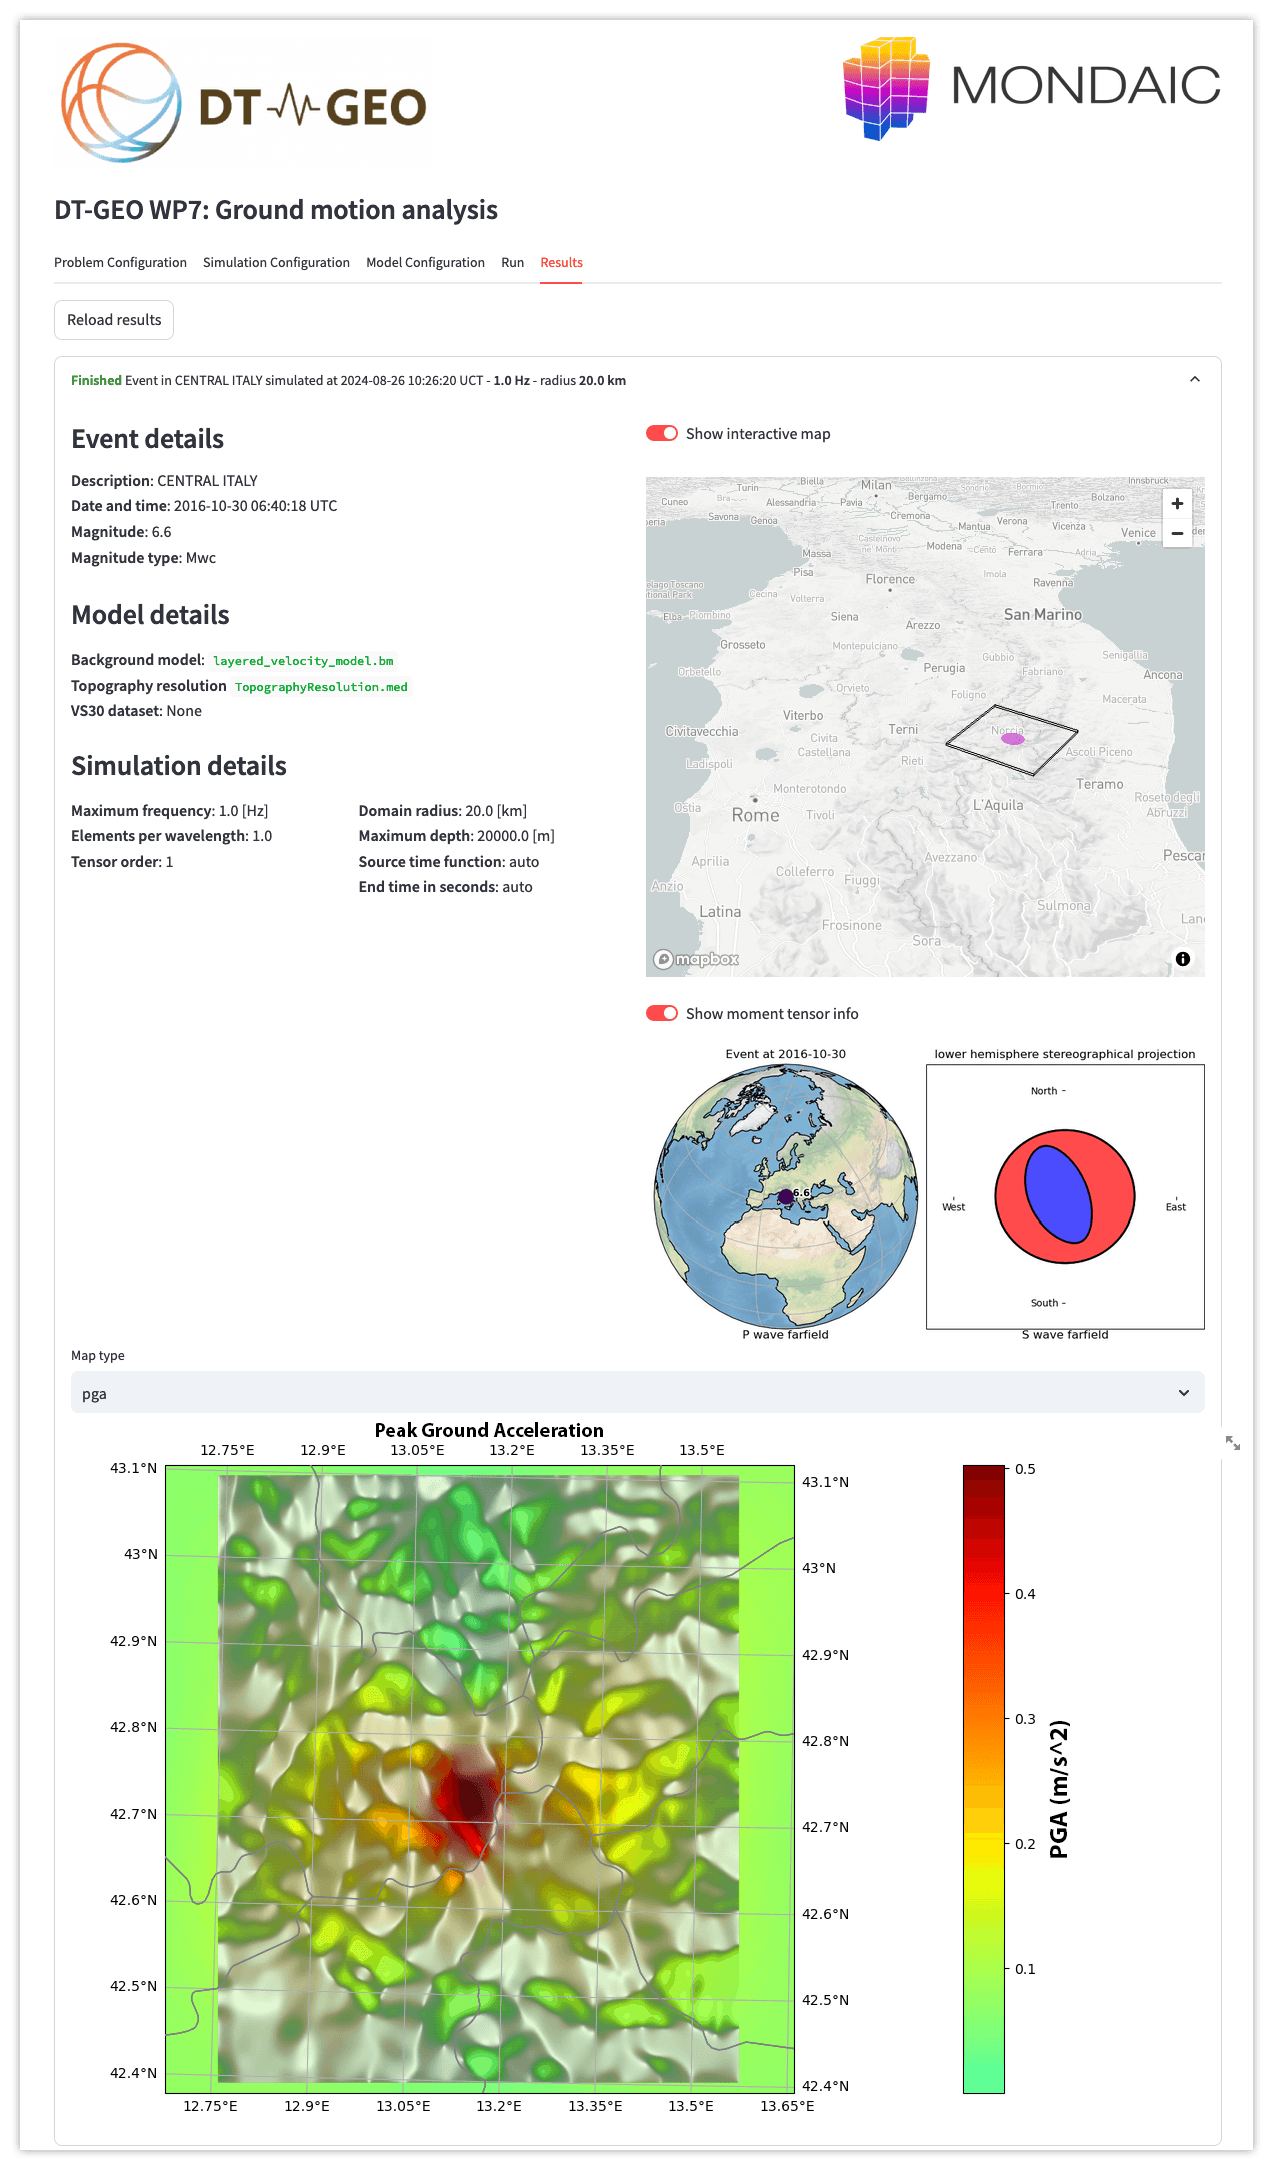
- Compute and visualize derived metrics directly in the dashboard such as Peak Ground Acceleration (PGA) or Peak Spectral Acceleration (PSA).
- Allow the export of time series data for further custom analysis by the user.
The dashboard giving access to key simulation metrics such as PGA is essential for users to do rapid development of their risk analysis. Shown below are the results for the event in Italy. Notable is that the distribution of PGA values is highly dependent only spatial variations of topography and VS30.
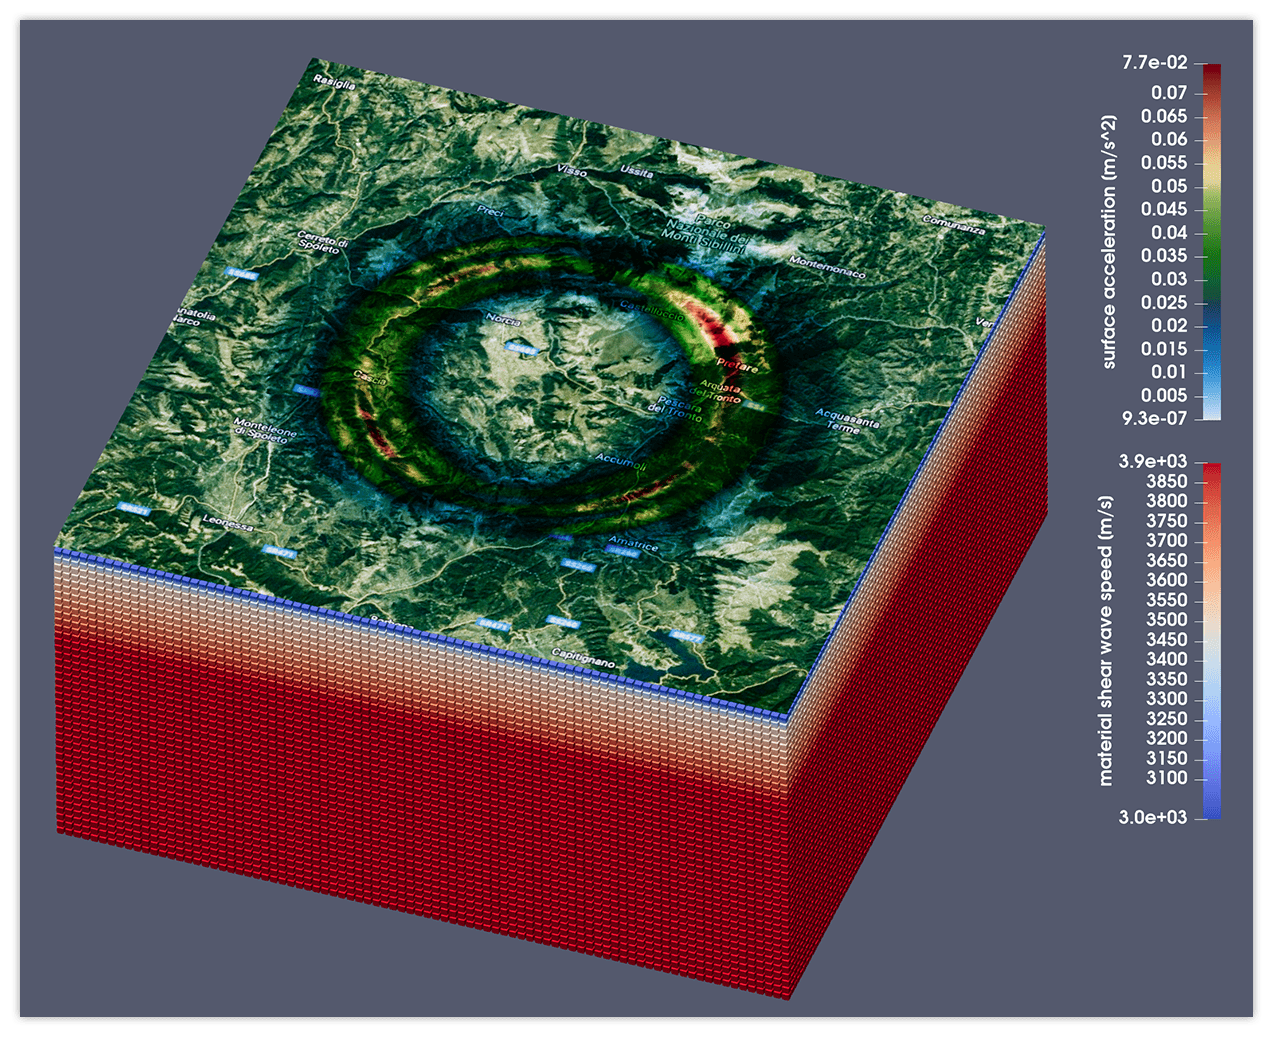
Although using this dashboard allows for quick development cycles of hazard assessment while evaluating key metrics, it should be noted that it is powered by Salvus' full generality: all wavefield simulation's outputs are also available on disk. Using e.g. Paraview's powerful visualization, these results can be interpreted in detail, or even loaded into Python using h5py or Salvus' WavefieldOutput objects.
Funding
This work has received funding from the European Union's Horizon Europe research and innovation programme under grant agreement no. 101058129 (DT-Geo). Visit the DT Geo website for more information.

 Mondaic